Site Diagram Precedents – Interacting Forces & Systems through Schedule & Mapping Techniques

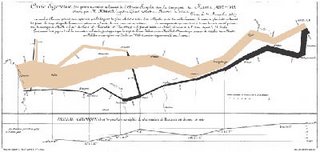
Napoleon’s March, 1857, Charles Joseph Minard,
see The Visual Display of Quantitative Information, Tuftee
In this diagram Minnard works several competing registers: distance and geography (in the colored paths), volume of soldiers (in the width of the path), temperature and time (keyed to the black band of returning soldiers) to display the forces – weather, battles, river fordings – that converged in this tragic military campaign.

<< Home